मुख्य सामग्री पर जाएं

एक्सेल में उच्चतम या निम्नतम मान का चयन कैसे करें?

लेखक: केली अंतिम संशोधित: 2020-11-27

कभी-कभी आपको स्प्रेडशीट या चयन में उच्चतम या निम्नतम मानों का पता लगाने और चयन करने की आवश्यकता हो सकती है, जैसे कि उच्चतम बिक्री राशि, न्यूनतम कीमत, आदि। आप इससे कैसे निपटेंगे? यह आलेख आपके लिए चयनों में उच्चतम मानों और निम्नतम मानों का पता लगाने और चयन करने के लिए कुछ पेचीदा युक्तियाँ लेकर आया है।


सूत्रों के साथ चयन में उच्चतम या निम्नतम मान ज्ञात करें


किसी श्रेणी में सबसे बड़ी या सबसे छोटी संख्या प्राप्त करने के लिए:

आप जिस रिक्त कक्ष में परिणाम प्राप्त करना चाहते हैं, उसमें बस नीचे दिया गया सूत्र दर्ज करें:

Get the largest value: =Max (B2:F10)
Get the smallest value: =Min (B2:F10)

और फिर दबाएँ दर्ज श्रेणी में सबसे बड़ी या सबसे छोटी संख्या प्राप्त करने के लिए कुंजी, स्क्रीनशॉट देखें:


किसी श्रेणी में सबसे बड़ी 3 या सबसे छोटी 3 संख्याएँ प्राप्त करने के लिए:

कभी-कभी, आप किसी वर्कशीट से सबसे बड़ी या सबसे छोटी 3 संख्याएं ढूंढना चाह सकते हैं, इस अनुभाग में, मैं इस समस्या को हल करने के लिए आपके लिए सूत्र पेश करूंगा, कृपया निम्नानुसार करें:

कृपया नीचे दिए गए सूत्र को एक सेल में दर्ज करें:

Get the largest 3 values: =LARGE(B2:F10,1)&", "&LARGE(B2:F10,2)&", "&LARGE(B2:F10,3)
Get the smallest 3 values: =SMALL(B2:F10,1)&", "&SMALL(B2:F10,2)&", "&SMALL(B2:F10,3)

  • सुझाव: यदि आप सबसे बड़ी या छोटी 5 संख्याएँ खोजना चाहते हैं, तो आपको इस तरह बड़े या छोटे फ़ंक्शन में शामिल होने के लिए & का उपयोग करना होगा:
  • =LARGE(B2:F10,1)&", "&LARGE(B2:F10,2)&", "&LARGE(B2:F10,3)&","&LARGE(B2:F10,4) &","&LARGE(B2:F10,5)

टिप्स: इन सूत्रों को याद रखना बहुत कठिन है, लेकिन यदि आपके पास है ऑटो टेक्स्ट का लक्षण एक्सेल के लिए कुटूल, यह आपकी ज़रूरत के सभी फ़ॉर्मूले को सहेजने और आपकी इच्छानुसार कहीं भी, कभी भी उनका पुन: उपयोग करने में आपकी सहायता करता है।     एक्सेल के लिए कुटूल डाउनलोड करने के लिए क्लिक करें!


सशर्त स्वरूपण के साथ चयन में उच्चतम या निम्नतम मान ढूंढें और हाइलाइट करें

आम तौर पर, इस सशर्त फॉर्मेटिंग यह सुविधा कक्षों की श्रेणी से सबसे बड़े या सबसे छोटे n मानों को खोजने और चुनने में भी मदद कर सकती है, कृपया ऐसा करें:

1। क्लिक करें होम > सशर्त फॉर्मेटिंग > ऊपर/नीचे नियम > शीर्ष 10 आइटम, स्क्रीनशॉट देखें:

2. में शीर्ष 10 आइटम संवाद बॉक्स में, सबसे बड़े मानों की संख्या दर्ज करें जिन्हें आप ढूंढना चाहते हैं, और फिर उनके लिए एक प्रारूप चुनें, और सबसे बड़े एन मानों को हाइलाइट किया गया है, स्क्रीनशॉट देखें:

  • सुझाव: न्यूनतम n मानों को खोजने और हाइलाइट करने के लिए, आपको बस क्लिक करना होगा होम > सशर्त फॉर्मेटिंग > ऊपर/नीचे नियम > नीचे के 10 आइटम।

एक शक्तिशाली सुविधा के साथ चयन में सभी उच्चतम या निम्नतम मान का चयन करें

RSI एक्सेल के लिए कुटूल's अधिकतम और न्यूनतम मान वाले सेल चुनें इससे आपको न केवल उच्चतम या निम्नतम मूल्यों का पता लगाने में मदद मिलेगी, बल्कि चयन में उन सभी को एक साथ चुनने में भी मदद मिलेगी।

सुझाव:इसे लागू करने के लिए अधिकतम और न्यूनतम मान वाले सेल चुनें सुविधा, सबसे पहले, आपको डाउनलोड करना चाहिए एक्सेल के लिए कुटूल, और फिर सुविधा को जल्दी और आसानी से लागू करें।

स्थापित करने के बाद एक्सेल के लिए कुटूल, कृपया ऐसा करें:

1. वह श्रेणी चुनें जिसके साथ आप काम करेंगे, फिर क्लिक करें कुटूल > चुनते हैं > अधिकतम और न्यूनतम मान वाले सेल चुनें..., स्क्रीनशॉट देखें:

3. में अधिकतम और न्यूनतम मान वाले सेल चुनें संवाद बकस:

  • (1.) खोजने के लिए कक्षों का प्रकार निर्दिष्ट करें (सूत्र, मान, या दोनों)। यहां देखो डिब्बा;
  • (2.) फिर जांचें अधिकतम मूल्य or न्यूनतम मूल्य जैसी तुम्हारी ज़रूरत है;
  • (3.) और वह दायरा निर्दिष्ट करें जिसके आधार पर सबसे बड़ा या सबसे छोटा हो, कृपया यहां चुनें सेल.
  • (4.) और फिर यदि आप पहले मिलान वाले सेल का चयन करना चाहते हैं, तो बस चुनें केवल प्रथम सेल विकल्प, सभी मिलान कक्षों का चयन करने के लिए, कृपया चुनें सभी सेल विकल्प.

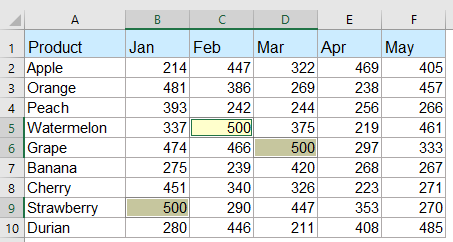
4। और फिर क्लिक करें OK, यह चयन में सभी उच्चतम मानों या निम्नतम मानों का चयन करेगा, निम्नलिखित स्क्रीनशॉट देखें:

सभी सबसे छोटे मानों का चयन करें

सभी सबसे बड़े मानों का चयन करें
अभी एक्सेल के लिए कुटूल डाउनलोड करें और निःशुल्क परीक्षण करें!


एक शक्तिशाली सुविधा के साथ प्रत्येक पंक्ति या स्तंभ में उच्चतम या निम्नतम मान का चयन करें

यदि आप प्रत्येक पंक्ति या स्तंभ में उच्चतम या निम्नतम मान ढूंढना और चुनना चाहते हैं, तो एक्सेल के लिए कुटूल भी आप पर एक उपकार कर सकते हैं, कृपया निम्नानुसार करें:

1. उस डेटा श्रेणी का चयन करें जिसे आप सबसे बड़ा या सबसे छोटा मान चुनना चाहते हैं। तब दबायें कुटूल > चुनते हैं > अधिकतम और न्यूनतम मान वाले सेल चुनें इस सुविधा को सक्षम करने के लिए

2. में अधिकतम और न्यूनतम मान वाले सेल चुनें संवाद बॉक्स में, अपनी आवश्यकतानुसार निम्नलिखित परिचालन सेट करें:

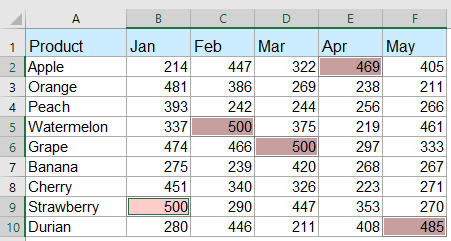
4। तब दबायें Ok बटन, प्रत्येक पंक्ति या कॉलम में सभी सबसे बड़े या सबसे छोटे मान एक ही बार में चुने जाते हैं, स्क्रीनशॉट देखें:

प्रत्येक पंक्ति में सबसे बड़ा मान

प्रत्येक कॉलम में सबसे बड़ा मान
अभी एक्सेल के लिए कुटूल डाउनलोड करें और निःशुल्क परीक्षण करें!


कक्षों की श्रेणी या प्रत्येक स्तंभ और पंक्ति में सबसे बड़े या सबसे छोटे मान वाले सभी कक्षों को चुनें या हाइलाइट करें

- एक्सेल के लिए कुटूल's अधिकतम और न्यूनतम मान वाले सेल चुनें सुविधा, आप अपनी आवश्यकतानुसार कक्षों की श्रेणी, प्रत्येक पंक्ति या प्रत्येक स्तंभ से सभी सबसे बड़े या सबसे छोटे मानों को तुरंत चुन या हाइलाइट कर सकते हैं। कृपया नीचे दिया गया डेमो देखें।    एक्सेल के लिए कुटूल डाउनलोड करने के लिए क्लिक करें!


अधिक सापेक्ष सबसे बड़े या सबसे छोटे मूल्य वाले लेख:

  • एक्सेल में डुप्लिकेट के बिना नौवां सबसे बड़ा मान ढूंढें और प्राप्त करें
  • एक्सेल वर्कशीट में, हम लार्ज फ़ंक्शन को लागू करके सबसे बड़ा, दूसरा सबसे बड़ा या nवां सबसे बड़ा मान प्राप्त कर सकते हैं। लेकिन, यदि सूची में डुप्लिकेट मान हैं, तो nवां सबसे बड़ा मान निकालते समय यह फ़ंक्शन डुप्लिकेट को नहीं छोड़ेगा। इस मामले में, आप Excel में डुप्लिकेट के बिना nवां सबसे बड़ा मान कैसे प्राप्त कर सकते हैं?
  • एक्सेल में नौवां सबसे बड़ा/सबसे छोटा अद्वितीय मान खोजें
  • यदि आपके पास संख्याओं की एक सूची है जिसमें कुछ डुप्लिकेट शामिल हैं, तो इन संख्याओं के बीच nवां सबसे बड़ा या सबसे छोटा मान प्राप्त करने के लिए, सामान्य बड़ा और छोटा फ़ंक्शन डुप्लिकेट सहित परिणाम लौटाएगा। आप Excel में डुप्लिकेट को अनदेखा करके nवां सबसे बड़ा या सबसे छोटा मान कैसे लौटा सकते हैं?
  • प्रत्येक पंक्ति या कॉलम में सबसे बड़ा/न्यूनतम मान हाइलाइट करें
  • यदि आपके पास एकाधिक कॉलम और पंक्तियों का डेटा है, तो आप प्रत्येक पंक्ति या कॉलम में सबसे बड़े या निम्नतम मान को कैसे हाइलाइट कर सकते हैं? यदि आप प्रत्येक पंक्ति या स्तंभ में एक-एक करके मानों की पहचान करेंगे तो यह कठिन होगा। इस मामले में, एक्सेल में कंडीशनल फ़ॉर्मेटिंग सुविधा आपकी मदद कर सकती है। विवरण जानने के लिए कृपया और पढ़ें।
  • एक्सेल की सूची में सबसे बड़े या सबसे छोटे 3 मानों का योग
  • SUM फ़ंक्शन का उपयोग करके संख्याओं की एक श्रृंखला को जोड़ना हमारे लिए आम बात है, लेकिन कभी-कभी, हमें किसी श्रेणी में सबसे बड़ी या सबसे छोटी 3, 10 या n संख्याओं को जोड़ने की आवश्यकता होती है, यह एक जटिल कार्य हो सकता है। आज मैं आपको इस समस्या को हल करने के लिए कुछ सूत्रों से परिचित कराता हूँ।

सर्वोत्तम कार्यालय उत्पादकता उपकरण

🤖 कुटूल्स एआई सहयोगी: निम्न के आधार पर डेटा विश्लेषण में क्रांति लाएं: बुद्धिमान निष्पादन   |  कोड जनरेट करें  |  कस्टम फ़ॉर्मूले बनाएं  |  डेटा का विश्लेषण करें और चार्ट बनाएं  |  कुटूल फ़ंक्शंस का आह्वान करें...
लोकप्रिय सुविधाएँ: डुप्लिकेट ढूंढें, हाइलाइट करें या पहचानें   |  रिक्त पंक्तियाँ हटाएँ   |  डेटा खोए बिना कॉलम या सेल को संयोजित करें   |   फॉर्मूला के बिना गोल ...
सुपर लुकअप: एकाधिक मानदंड VLookup    मल्टीपल वैल्यू वीलुकअप  |   अनेक शीटों में VLookup   |   फजी लुकअप ....
उन्नत ड्रॉप-डाउन सूची: शीघ्रता से ड्रॉप डाउन सूची बनाएं   |  आश्रित ड्रॉप डाउन सूची   |  बहु-चयन ड्रॉप डाउन सूची ....
स्तम्भ प्रबंधक: कॉलमों की एक विशिष्ट संख्या जोड़ें  |  कॉलम ले जाएँ  |  छिपे हुए कॉलम की दृश्यता स्थिति टॉगल करें  |  रेंज और कॉलम की तुलना करें ...
फीचर्ड फीचर्स: ग्रिड फोकस   |  डिजाइन देखें   |   बड़ा फॉर्मूला बार    कार्यपुस्तिका एवं शीट प्रबंधक   |  संसाधन लाइब्रेरी (ऑटो टेक्स्ट)   |  खजूर बीनने वाला   |  कार्यपत्रकों को संयोजित करें   |  एन्क्रिप्ट/डिक्रिप्ट सेल    सूची के अनुसार ईमेल भेजें   |  सुपर फ़िल्टर   |   विशेष फ़िल्टर (फ़िल्टर बोल्ड/इटैलिक/स्ट्राइकथ्रू...) ...
शीर्ष 15 टूलसेट12 टेक्स्ट टूल्स (पाठ जोड़ें, अक्षर हटाएँ, ...)   |   50 + चार्ट प्रकार (गैन्ट चार्ट, ...)   |   40+ प्रैक्टिकल सूत्र (जन्मदिन के आधार पर आयु की गणना करें, ...)   |   19 निवेशन टूल्स (QR कोड डालें, पथ से चित्र सम्मिलित करें, ...)   |   12 रूपांतरण टूल्स (शब्दों को संख्याएँ, मुद्रा रूपांतरण, ...)   |   7 विलय और विभाजन टूल्स (उन्नत संयोजन पंक्तियाँ, विभाजन कोशिकाओं, ...)   |   ... और अधिक

एक्सेल के लिए कुटूल के साथ अपने एक्सेल कौशल को सुपरचार्ज करें, और पहले जैसी दक्षता का अनुभव करें। एक्सेल के लिए कुटूल उत्पादकता बढ़ाने और समय बचाने के लिए 300 से अधिक उन्नत सुविधाएँ प्रदान करता है।  वह सुविधा प्राप्त करने के लिए यहां क्लिक करें जिसकी आपको सबसे अधिक आवश्यकता है...

Description


ऑफिस टैब ऑफिस में टैब्ड इंटरफ़ेस लाता है, और आपके काम को बहुत आसान बनाता है

  • Word, Excel, PowerPoint में टैब्ड संपादन और रीडिंग सक्षम करें, प्रकाशक, एक्सेस, विसियो और प्रोजेक्ट।
  • नई विंडो के बजाय एक ही विंडो के नए टैब में एकाधिक दस्तावेज़ खोलें और बनाएं।
  • आपकी उत्पादकता 50% बढ़ जाती है, और आपके लिए हर दिन सैकड़ों माउस क्लिक कम हो जाते हैं!
Comments (39)
Rated 5 out of 5 · 1 ratings
This comment was minimized by the moderator on the site
Hi, any idea why this formula does not work: =MAX(B5,B8,B11,B14)-MIN(B5,B8,B11,B14)

=MAX(B5:B14)-MIN(B5:B14) works but I want just the four cells, not the whole range...
This comment was minimized by the moderator on the site
Hi there,

The formula should work. Is there anything wrong with the data type?

Amanda
This comment was minimized by the moderator on the site
Hi, can u help me. i got some problem on how to retrieve which outlet got lowest growth percentage since the percentage got duplicate value

for example

PEN001 -83.33%
PEN002 -83.33%
PEN003 -92.31%
PEN004 -100.00%
PEN005 -100.00%

I'm using index match min (lowest) & small (for 2nd lowest), but the result will return PEN004 for both condition which is the lowest and 2nd lowest
This comment was minimized by the moderator on the site
Hi,

To ignore the duplicate values and only count unique values, you can use the formula below:
=INDEX(A1:A6,MATCH(SMALL(IF(ISNUMBER(B1:B6),IF(ROW(B1:B6)=MATCH(B1:B6,B1:B6,0),B1:B6)),2),B1:B6,0))

In the above formula, A1:A6 is the list of PEN00N, B1:B6 is the list of percentages, 2 means to get the 2nd lowest value.
https://www.extendoffice.com/images/stories/comments/ljy-picture/2nd_unique_lowest_value.png

Note that this formula works for unique values only, which means it will only return the first value if there are duplicates.

Amanda
This comment was minimized by the moderator on the site
Cześć,

Potrzebuje poznać sposób na rozbudowanie komendy max/min by w docelowej komórce pokazywała wartość wraz z kolorem komórki.

Przykład
mam 3 dostawców z różnymi cenami tych samych produktów (produkty pionowo, dostawcy poziomo)
Dostawcy są przykładowo w kolumnach E,F,G i każdemu przydzieliłem inny kolor, który obowiązuje również ceny danego dostawcy.
W komórkach H chciałbym by pokazała się najniższa cena wraz z kolorem danego dostawcy.

dzięki!
This comment was minimized by the moderator on the site
Hi there,

Let's say the table is as shown below, you could use Excel's Conditional formatting to get the result you want:
https://www.extendoffice.com/images/stories/comments/ljy-picture/example.png

1. Enter =MIN(E1:G1,I1) in cell H1, and then copy the formula to below cells.
https://www.extendoffice.com/images/stories/comments/ljy-picture/get-min.png
2. Selet the list H1: H5, and then on the Home tab, click Conditional Formatting > New rule.
3. In the dialog box, selet Use a formula to determine which cells to format; Enter =$H1=$E1; And then click on Format to choose the background color of cell E1.
https://www.extendoffice.com/images/stories/comments/ljy-picture/create-rule.png
4. Repeat the step 3 to create rules for other background colors: =$H1=$F1 > light blue; =$H1=$G1 > light green; ...

Now, your table should look like this:
https://www.extendoffice.com/images/stories/comments/ljy-picture/result.png

Amanda
This comment was minimized by the moderator on the site
I have a table and I need to sum the columns(which I have done) then I need to find the lowest value (which I have done) how do I display the column title of the lowest value?

Thanks
This comment was minimized by the moderator on the site
Hi, could you please show me a screenshot of your data?

Amanda
This comment was minimized by the moderator on the site
Bonjour Amanda

Ca marche !!!! 😀 🤩 👌
Merci vraiment

Puis-je vous demander de nouveau votre aide ?
Voici la formule que je recherche

A1 A2 A3 A4
Chien Colibri Renard OK
Chat Renard Chien OK
Souris Chien Lion Non
Colibri Ecureuil Marmotte Non
Eléphant Colibri Chat OK

Si en A3 on retrouve les mots des colonnes A1 et A2 alors la colonne A4 indique OK
Si en A3 on ne retrouve pas les mots des colonnes A1 et A2 alors la colonne A4 indique Non

Merci encore pour votre aide très précieuse pour une débutante en excel

Bonne journée
Rated 5 out of 5
This comment was minimized by the moderator on the site
Hi, I don't quite understand why did you asign OK to the first and second rows, since I don't see that the third value is the same as the first or second one.

Amanda
This comment was minimized by the moderator on the site
Bonjour Amanda,

Je vous ai renvoyé le fichier à l'adresse mail indiquée : à l'instant

Merci encore une fois de votre aide.

Bien cordialement
This comment was minimized by the moderator on the site
Hi there,

I tried your excel file in the French enviorment, please use =IF(A1=MAX($A$1:$A$4);1;0).
The seperator should be ";" instead of "," 😅
(If the formula does not work, use SI instead of IF)

Amanda
This comment was minimized by the moderator on the site
Bonjour Amanda

Ne pouvons joindre de fichier sur le site, j'ai répondu au mail que vous m'avez envoyé et j'y ai joins le fichier excel
Vous pourrez voir ainsi que cela me mets en erreur.

Merci encore de votre aide

Bien cordialement
This comment was minimized by the moderator on the site
Hi there,

Did you send the excel file to ?
I did not receive any messages about the issue. Could you please send that again?
Also, I think the .xlsx file is supported to upload here. If you want, you can just upload it here in a comment.

Amanda
This comment was minimized by the moderator on the site
Bonjour,
En premier lieu merci pour tout ça j'y ai trouvé plein plein de soluces.
Ma question est la suivante
J'ai une colonne avec des chiffres

26.56250
25.10400
26.29101
27.66667

Et je voudrais en parallèle une formule qui va me dire non seulement le nombre le plus élevé (ça j'ai trouvé dans vos explications) mais que cette colonne indique 1 pour le chiffre le plus élevé.
Voici un exemple

26.56250 = 0
25.10400 = 0
26.29101 = 0
27.66667 = 1

Pensez-vous que cela soit possible et si oui via quelle formule ?

Je vous remercie encore et par avance en + 😄

Bien cordialement
This comment was minimized by the moderator on the site
Hi there,

Let's say the four values are in range A1:A4, you can enter the below formula in B1:
=IF(A1=MAX($A$1:$A$4),1,0)
And then drag the fill handle down to apply the formula to below cells.
https://www.extendoffice.com/images/stories/comments/ljy-picture/return-1-if-max.png

Amanda
This comment was minimized by the moderator on the site
Bonjour Amandine
Tout d'abord merci pour cette réponse.
Malheureusement cela ne fonctionne pas <font style="vertical-align: inherit;"><font style="vertical-align: inherit;">😞</font></font>

J'ai le message d'erreur habituel
Pouvez-vous m'aider encore une fois ?

Merci
This comment was minimized by the moderator on the site
Hi there,

Can tell me what error it is? I noticed that you are using French, so please try SI instead of IF: =SI(A1=MAX($A$1:$A$4),1,0)

Amanda
This comment was minimized by the moderator on the site
Good day
I have difficulty with excel and don't know the exact names of what I want but will give it a try ?

1. I have 4 Colom's A, B, C, D, =MAX()
9, 2, 4, 1,
I want a formula that include the A,B,C,D, for instance, want the formula to include the "A" and "9" as well like A9?


2 A, B, C, D,
9, 8, 9, 2,
I also need a formula for if there is 2 (or 3 or even 4) equals highs, where I can "A9" and "C9" selected as highest ?

3 base on this information how can I create an automated report for the login user once they have selected the highest value ?

4. Maybe this is not the place to ask, but how can I create a time limit for the usage of the excel workbook that expires after 30 minutes and automatically email the report
to the login user?

5. lastly the report that the user will receive is in word format

Thank you so much
Have a wonderful day
This comment was minimized by the moderator on the site
How do I write a formula to find the smallest percentage in these 3 columns and return the value as LAG Alt or GDF or DEL?
LAG ALT -5% GDF -32% DEL 28%

In example above LAG ALT is the smallest percent/Choice I would want
This comment was minimized by the moderator on the site
Hi, the value to be compared and text string have to be in two cells for excel to compre. I have wrote a formula to get the result you want: =INDEX(A2:C2,MATCH(MIN(ABS(A3:C3)),ABS(A3:C3),0)) Please refer to the screenshot to see how it works. For more details about the formula, please click the link below. I only added ABS function (to get the absolute value) to the formula listed in the article: https://www.extendoffice.com/excel/formulas/excel-get-information-corresponding-to-minimum-value.html
There are no comments posted here yet
Load More
Please leave your comments in English
Posting as Guest
×
Rate this post:
0   Characters
Suggested Locations