मुख्य सामग्री पर जाएं

Excel में चार्ट या ग्राफ़ से डेटा कैसे निकालें?

लेखक: रवि अंतिम संशोधित: 2022-05-10
दस्तावेज़-निकालें-चार्ट-डेटा-1
एक्सेल में, हम आम तौर पर अधिक स्पष्ट रूप से देखने के लिए डेटा और रुझान दिखाने के लिए चार्ट का उपयोग करते हैं, लेकिन कभी-कभी, हो सकता है कि चार्ट एक प्रतिलिपि हो और आपके पास चार्ट का मूल डेटा न हो जैसा कि नीचे स्क्रीनशॉट में दिखाया गया है। इस मामले में, आप इस चार्ट से डेटा निकालना चाह सकते हैं। अब यह ट्यूटोरियल चार्ट या ग्राफ़ से डेटा निकालने के बारे में बात कर रहा है।
वीबीए के साथ चार्ट से डेटा निकालें

तीर नीला दायां बुलबुला वीबीए के साथ चार्ट से डेटा निकालें

1. आपको एक नई वर्कशीट बनानी होगी और उसका नाम बदलना होगा चार्टडेटा. स्क्रीनशॉट देखें:

दस्तावेज़-निकालें-चार्ट-डेटा-5

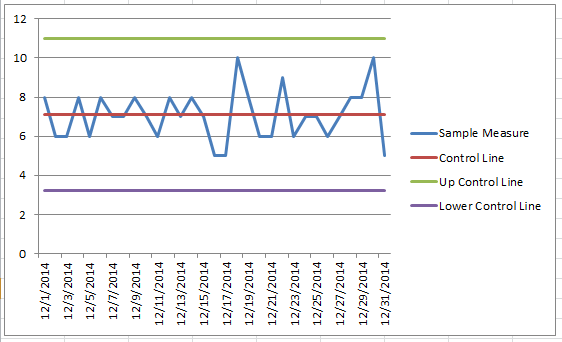
2. फिर उस चार्ट का चयन करें जिससे आप डेटा निकालना चाहते हैं और दबाएँ ऑल्ट + F11 एक साथ चाबियाँ, और ए अनुप्रयोगों के लिए माइक्रोसॉफ्ट विज़ुअल बेसिक खिड़की चबूतरे.

3। क्लिक करें सम्मिलित करें > मॉड्यूल, फिर पॉपिंग पर VBA कोड के नीचे पेस्ट करें मॉड्यूल खिड़की.

वीबीए: चार्ट से डेटा निकालें।

Sub GetChartValues()
    'Updateby20220510
    Dim xNum As Integer
    Dim xSeries As Object
    On Error Resume Next
    xCount = 2
    xNum = UBound(Application.ActiveChart.SeriesCollection(1).Values)
    Application.Worksheets("ChartData").Cells(1, 1) = "X Values"
    With Application.Worksheets("ChartData")
        .Range(.Cells(2, 1), _
        .Cells(xNum + 1, 1)) = _
        Application.Transpose(ActiveChart.SeriesCollection(1).XValues)
    End With
    For Each xSeries In Application.ActiveChart.SeriesCollection
        Application.Worksheets("ChartData").Cells(1, xCount) = xSeries.Name
        With Application.Worksheets("ChartData")
            .Range(.Cells(2, xCount), _
            .Cells(xNum + 1, xCount)) = _
            Application.WorksheetFunction.Transpose(xSeries.Values)
        End With
        xCount = xCount + 1
    Next
End Sub

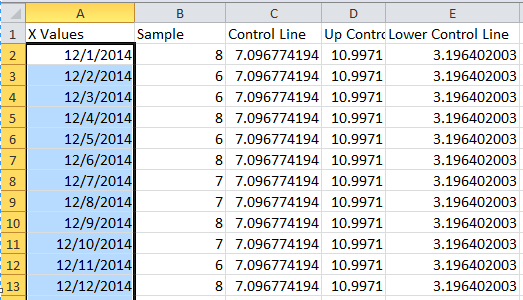
4। तब दबायें रन VBA चलाने के लिए बटन. स्क्रीनशॉट देखें:

दस्तावेज़-निकालें-चार्ट-डेटा-2

फिर आप देख सकते हैं कि डेटा निकाला गया है चार्टडेटा चादर।
दस्तावेज़-निकालें-चार्ट-डेटा-3

सुझाव:

1. आप अपनी आवश्यकतानुसार सेलों को प्रारूपित कर सकते हैं।

दस्तावेज़-निकालें-चार्ट-डेटा-4

2. चयनित चार्ट का डेटा डिफ़ॉल्ट रूप से चार्टडेटा शीट के पहले सेल में निकाला जाता है।


सुझाव: यदि आप आमतौर पर एक्सेल में जटिल चार्ट का उपयोग करते हैं, जो परेशानी भरा होगा क्योंकि आप उन्हें बहुत समय में बनाते हैं, तो यहां देखें ऑटो टेक्स्ट का उपकरण एक्सेल के लिए कुटूल, आपको बस पहली बार चार्ट बनाने की आवश्यकता है, फिर ऑटोटेक्स्ट फलक में चार्ट जोड़ें, फिर, आप उन्हें कहीं भी, कभी भी पुन: उपयोग कर सकते हैं, आपको केवल अपनी वास्तविक आवश्यकता से मेल खाने के लिए संदर्भों को बदलना होगा।  इसे अभी मुफ्त डाउनलोड करने के लिए क्लिक करें.
दस्तावेज़ सशर्त स्वरूपण स्टैक्ड बार चार्ट 12

सर्वोत्तम कार्यालय उत्पादकता उपकरण

🤖 कुटूल्स एआई सहयोगी: निम्न के आधार पर डेटा विश्लेषण में क्रांति लाएं: बुद्धिमान निष्पादन   |  कोड जनरेट करें  |  कस्टम फ़ॉर्मूले बनाएं  |  डेटा का विश्लेषण करें और चार्ट बनाएं  |  कुटूल फ़ंक्शंस का आह्वान करें...
लोकप्रिय सुविधाएँ: डुप्लिकेट ढूंढें, हाइलाइट करें या पहचानें   |  रिक्त पंक्तियाँ हटाएँ   |  डेटा खोए बिना कॉलम या सेल को संयोजित करें   |   फॉर्मूला के बिना गोल ...
सुपर लुकअप: एकाधिक मानदंड VLookup    मल्टीपल वैल्यू वीलुकअप  |   अनेक शीटों में VLookup   |   फजी लुकअप ....
उन्नत ड्रॉप-डाउन सूची: शीघ्रता से ड्रॉप डाउन सूची बनाएं   |  आश्रित ड्रॉप डाउन सूची   |  बहु-चयन ड्रॉप डाउन सूची ....
स्तम्भ प्रबंधक: कॉलमों की एक विशिष्ट संख्या जोड़ें  |  कॉलम ले जाएँ  |  छिपे हुए कॉलम की दृश्यता स्थिति टॉगल करें  |  रेंज और कॉलम की तुलना करें ...
फीचर्ड फीचर्स: ग्रिड फोकस   |  डिजाइन देखें   |   बड़ा फॉर्मूला बार    कार्यपुस्तिका एवं शीट प्रबंधक   |  संसाधन लाइब्रेरी (ऑटो टेक्स्ट)   |  खजूर बीनने वाला   |  कार्यपत्रकों को संयोजित करें   |  एन्क्रिप्ट/डिक्रिप्ट सेल    सूची के अनुसार ईमेल भेजें   |  सुपर फ़िल्टर   |   विशेष फ़िल्टर (फ़िल्टर बोल्ड/इटैलिक/स्ट्राइकथ्रू...) ...
शीर्ष 15 टूलसेट12 टेक्स्ट टूल्स (पाठ जोड़ें, अक्षर हटाएँ, ...)   |   50 + चार्ट प्रकार (गैन्ट चार्ट, ...)   |   40+ प्रैक्टिकल सूत्र (जन्मदिन के आधार पर आयु की गणना करें, ...)   |   19 निवेशन टूल्स (QR कोड डालें, पथ से चित्र सम्मिलित करें, ...)   |   12 रूपांतरण टूल्स (शब्दों को संख्याएँ, मुद्रा रूपांतरण, ...)   |   7 विलय और विभाजन टूल्स (उन्नत संयोजन पंक्तियाँ, विभाजन कोशिकाओं, ...)   |   ... और अधिक

एक्सेल के लिए कुटूल के साथ अपने एक्सेल कौशल को सुपरचार्ज करें, और पहले जैसी दक्षता का अनुभव करें। एक्सेल के लिए कुटूल उत्पादकता बढ़ाने और समय बचाने के लिए 300 से अधिक उन्नत सुविधाएँ प्रदान करता है।  वह सुविधा प्राप्त करने के लिए यहां क्लिक करें जिसकी आपको सबसे अधिक आवश्यकता है...

Description


ऑफिस टैब ऑफिस में टैब्ड इंटरफ़ेस लाता है, और आपके काम को बहुत आसान बनाता है

  • Word, Excel, PowerPoint में टैब्ड संपादन और रीडिंग सक्षम करें, प्रकाशक, एक्सेस, विसियो और प्रोजेक्ट।
  • नई विंडो के बजाय एक ही विंडो के नए टैब में एकाधिक दस्तावेज़ खोलें और बनाएं।
  • आपकी उत्पादकता 50% बढ़ जाती है, और आपके लिए हर दिन सैकड़ों माउस क्लिक कम हो जाते हैं!
Comments (18)
No ratings yet. Be the first to rate!
This comment was minimized by the moderator on the site
Amazing...
This comment was minimized by the moderator on the site
Very helpful! Thanks a lot!
This comment was minimized by the moderator on the site
giving error and tell to set block variables and object variables
This comment was minimized by the moderator on the site
Hi, I have updated the VBA, you can try it again.
This comment was minimized by the moderator on the site
i tried above & it says "Compile error: Method or Data Member not found"
This comment was minimized by the moderator on the site
mong mọi người giúp đỡ làm cách nào để lấy số liệu từ biểu đồ này với ạ!
This comment was minimized by the moderator on the site
i m getting below error while running that command.
this error comes in that command which starts from xnum = UBound(......) etc

Run-Time error '91'
object variable or with block variable not set
This comment was minimized by the moderator on the site
Hi, tarshul, you need to create a new worksheet named ChartData before you running the code, the data will be place in the new worksheet ChartData.
This comment was minimized by the moderator on the site
Hi sunny,
I already create new worksheet as u told but still getting same error.
This comment was minimized by the moderator on the site
This doesn't appear to work for a scatter plot as it only extracts one set of "x" data. How can I amend it to extract all "x" data sets?
This comment was minimized by the moderator on the site
Sorry I did not found the solution about that.
This comment was minimized by the moderator on the site
i've tried with a scatter plot graph as well, but only get one line of valor.


i need so much to find a way to extract data from scatterplot graphs.
This comment was minimized by the moderator on the site
I failed to get the prices of a fund chart on my mac excel 2011 . Run time error '91' object variable or block variable not set . Don't know how to debug . Appreciate any help .
This comment was minimized by the moderator on the site
Very useful and perfect
This comment was minimized by the moderator on the site
gives me values that i created chart with not all the values in range
This comment was minimized by the moderator on the site
Amazing command, thanks a lot! I used it with a pivot chart and it works!
There are no comments posted here yet
Load More
Please leave your comments in English
Posting as Guest
×
Rate this post:
0   Characters
Suggested Locations