मुख्य सामग्री पर जाएं

एक्सेल में औसत/चक्रवृद्धि वार्षिक वृद्धि दर की गणना कैसे करें?

लेखक: केली अंतिम संशोधित: 2020-05-09

यह लेख एक्सेल में औसत वार्षिक वृद्धि दर (एएजीआर) और चक्रवृद्धि वार्षिक वृद्धि दर (सीएजीआर) की गणना करने के तरीकों के बारे में बात कर रहा है।


एक्सेल में चक्रवृद्धि वार्षिक वृद्धि दर की गणना करें

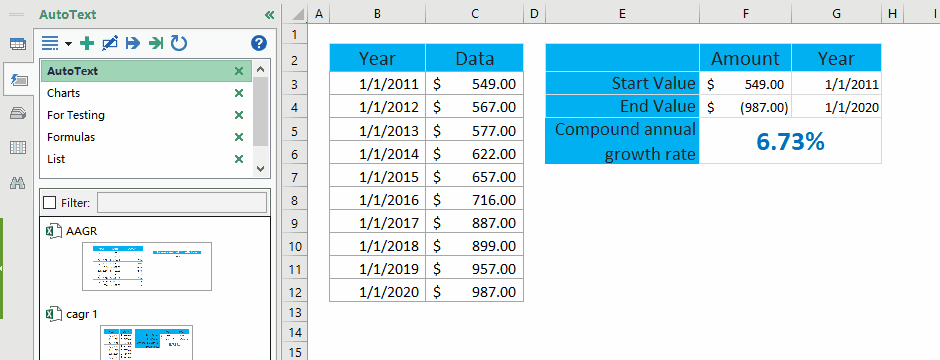
एक्सेल में चक्रवृद्धि वार्षिक वृद्धि दर की गणना करने के लिए एक मूल सूत्र है =((अंतिम मूल्य/प्रारंभ मूल्य)^(1/अवधि) -1. और हम इस सूत्र को निम्नलिखित प्रकार से आसानी से लागू कर सकते हैं:

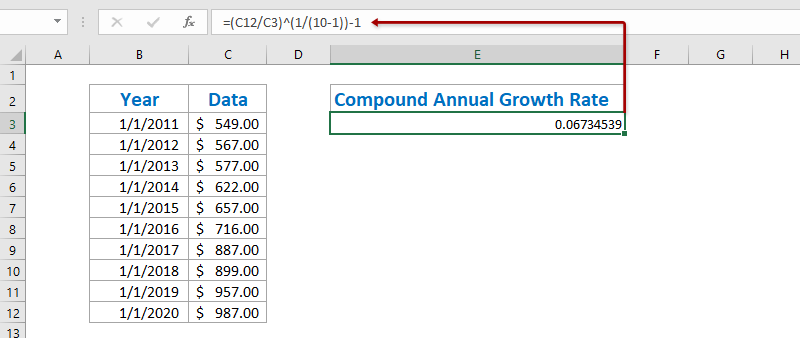
1. एक रिक्त सेल का चयन करें, उदाहरण के लिए सेल E3, उसमें नीचे दिया गया सूत्र दर्ज करें, और दबाएँ दर्ज चाबी। स्क्रीनशॉट देखें:

=(C12/C3)^(1/(10-1))-1

ध्यान दें: उपरोक्त सूत्र में, C12 अंतिम मान वाला सेल है, C3 प्रारंभ मान वाला सेल है, 10-1 प्रारंभ मान और अंतिम मान के बीच की अवधि है, और आप अपनी आवश्यकताओं के आधार पर उन्हें बदल सकते हैं।

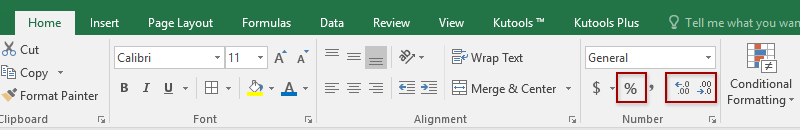
2. कुछ मामलों में, गणना परिणाम प्रतिशत के रूप में प्रारूपित नहीं हो सकता है। कृपया गणना परिणाम का चयन करते रहें, क्लिक करें प्रतिशत शैली बटन  पर होम संख्या को प्रतिशत प्रारूप में बदलने के लिए टैब, और फिर क्लिक करके उसके दशमलव स्थानों को बदलें दशमलव बढ़ाएँ बटन  or दशमलव घटाएं बटन . स्क्रीन शॉट देखें:


एक्सेल में एक्सआईआरआर फ़ंक्शन के साथ चक्रवृद्धि वार्षिक वृद्धि दर की गणना करें

दरअसल, एक्सआईआरआर फ़ंक्शन हमें एक्सेल में चक्रवृद्धि वार्षिक वृद्धि दर की आसानी से गणना करने में मदद कर सकता है, लेकिन इसके लिए आपको प्रारंभ मूल्य और अंतिम मूल्य के साथ एक नई तालिका बनाने की आवश्यकता होती है।

1. निम्न प्रथम स्क्रीन शॉट में दिखाए अनुसार प्रारंभ मान और अंतिम मान के साथ एक नई तालिका बनाएं:

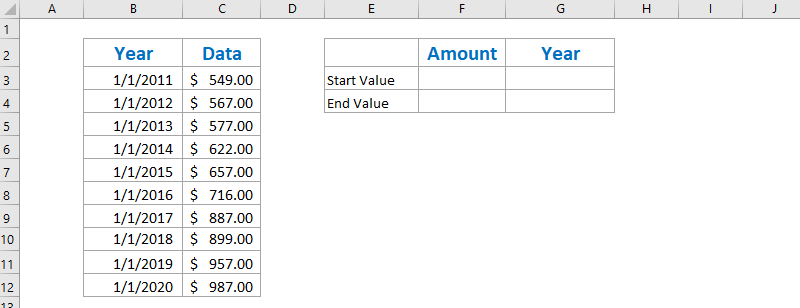
नोट: सेल F3 में =C3 दर्ज करें, सेल G3 में =B3 दर्ज करें, सेल F4 में =-C12 दर्ज करें, और सेल G4 में =B12 दर्ज करें, या आप सीधे इस तालिका में अपना मूल डेटा दर्ज कर सकते हैं। वैसे, आपको अंतिम मूल्य से पहले एक माइनस जोड़ना होगा।

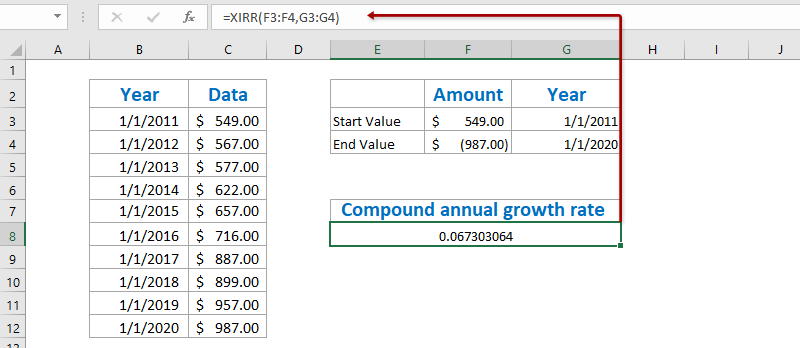
2. इस तालिका के नीचे एक रिक्त कक्ष का चयन करें, उसमें नीचे दिया गया सूत्र दर्ज करें, और दबाएँ दर्ज कुंजी।

=XIRR(F3:F4,G3:G4)

3. परिणाम को प्रतिशत प्रारूप में बदलने के लिए, इस XIRR फ़ंक्शन के साथ सेल का चयन करें, क्लिक करें प्रतिशत शैली बटन  पर होम टैब, और फिर क्लिक करके इसके दशमलव स्थानों को बदलें दशमलव बढ़ाएँ बटन  or दशमलव घटाएं बटन . स्क्रीन शॉट देखें:

सीएजीआर तालिका को तुरंत एक मिनी टेम्पलेट के रूप में सहेजें, और भविष्य में केवल एक क्लिक के साथ पुन: उपयोग करें

हर बार औसत की गणना के लिए कोशिकाओं को संदर्भित करना और सूत्र लागू करना बहुत कठिन होगा। एक्सेल के लिए कुटूल्स इसका एक सुंदर समाधान प्रदान करता है ऑटो टेक्स्ट रेंज को ऑटोटेक्स्ट प्रविष्टि के रूप में सहेजने के लिए उपयोगिता, जो रेंज में सेल प्रारूप और सूत्र बने रह सकती है। और फिर आप केवल एक क्लिक से इस रेंज का पुन: उपयोग करेंगे।

दस्तावेज़ सीएजीआर ऑटोटेक्स्ट


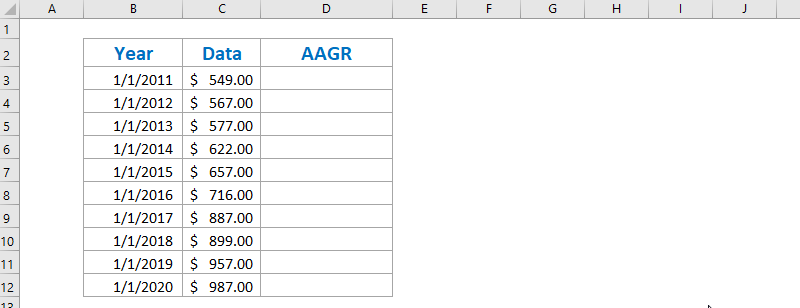
एक्सेल में औसत वार्षिक वृद्धि दर की गणना करें

एक्सेल में औसत वार्षिक वृद्धि दर की गणना करने के लिए, आम तौर पर हमें सूत्र के साथ हर साल की वार्षिक वृद्धि दर की गणना करनी होती है = (अंतिम मूल्य - आरंभिक मूल्य) / आरंभिक मूल्य, और फिर इन वार्षिक वृद्धि दरों का औसत निकालें। आप इस प्रकार कर सकते हैं:

1. मूल तालिका के अलावा, रिक्त सेल C3 में नीचे दिए गए सूत्र को दर्ज करें और फिर भरण हैंडल को रेंज C3:C11 तक खींचें।

=(सी4-सी3)/सी3

2. रेंज D4:D12 चुनें, क्लिक करें प्रतिशत शैली बटन  पर होम टैब, और फिर क्लिक करके इसके दशमलव स्थानों को बदलें दशमलव बढ़ाएँ बटन  or दशमलव घटाएं बटन . स्क्रीनशॉट देखें:

3. सेल F4 में नीचे दिए गए फॉर्मूले को दर्ज करके सभी वार्षिक वृद्धि दर का औसत निकालें और दबाएं दर्ज कुंजी।

=औसत(D4:D12)

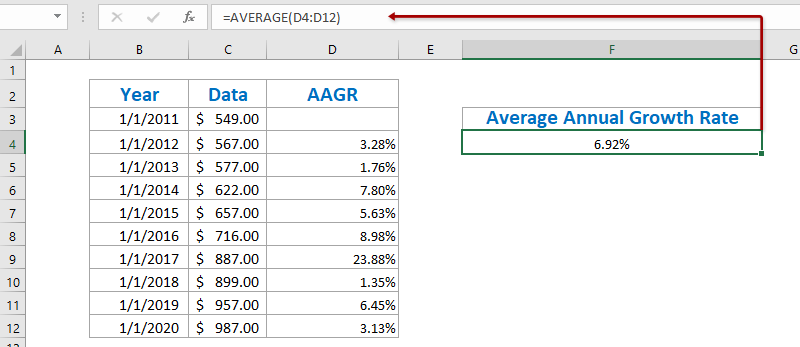
अब तक, औसत वार्षिक वृद्धि दर की गणना की गई है और सेल C12 में दिखाया गया है।


डेमो: एक्सेल में औसत/चक्रवृद्धि वार्षिक वृद्धि दर की गणना करें


एक्सेल के लिए कुटूल: आपकी उंगलियों पर 300 से अधिक उपयोगी उपकरण! आज ही बिना किसी सुविधा सीमा के अपना 30-दिवसीय निःशुल्क परीक्षण प्रारंभ करें। अब डाउनलोड करें!

संबंधित आलेख:

सर्वोत्तम कार्यालय उत्पादकता उपकरण

🤖 कुटूल्स एआई सहयोगी: निम्न के आधार पर डेटा विश्लेषण में क्रांति लाएं: बुद्धिमान निष्पादन   |  कोड जनरेट करें  |  कस्टम फ़ॉर्मूले बनाएं  |  डेटा का विश्लेषण करें और चार्ट बनाएं  |  कुटूल फ़ंक्शंस का आह्वान करें...
लोकप्रिय सुविधाएँ: डुप्लिकेट ढूंढें, हाइलाइट करें या पहचानें   |  रिक्त पंक्तियाँ हटाएँ   |  डेटा खोए बिना कॉलम या सेल को संयोजित करें   |   फॉर्मूला के बिना गोल ...
सुपर लुकअप: एकाधिक मानदंड VLookup    मल्टीपल वैल्यू वीलुकअप  |   अनेक शीटों में VLookup   |   फजी लुकअप ....
उन्नत ड्रॉप-डाउन सूची: शीघ्रता से ड्रॉप डाउन सूची बनाएं   |  आश्रित ड्रॉप डाउन सूची   |  बहु-चयन ड्रॉप डाउन सूची ....
स्तम्भ प्रबंधक: कॉलमों की एक विशिष्ट संख्या जोड़ें  |  कॉलम ले जाएँ  |  छिपे हुए कॉलम की दृश्यता स्थिति टॉगल करें  |  रेंज और कॉलम की तुलना करें ...
फीचर्ड फीचर्स: ग्रिड फोकस   |  डिजाइन देखें   |   बड़ा फॉर्मूला बार    कार्यपुस्तिका एवं शीट प्रबंधक   |  संसाधन लाइब्रेरी (ऑटो टेक्स्ट)   |  खजूर बीनने वाला   |  कार्यपत्रकों को संयोजित करें   |  एन्क्रिप्ट/डिक्रिप्ट सेल    सूची के अनुसार ईमेल भेजें   |  सुपर फ़िल्टर   |   विशेष फ़िल्टर (फ़िल्टर बोल्ड/इटैलिक/स्ट्राइकथ्रू...) ...
शीर्ष 15 टूलसेट12 टेक्स्ट टूल्स (पाठ जोड़ें, अक्षर हटाएँ, ...)   |   50 + चार्ट प्रकार (गैन्ट चार्ट, ...)   |   40+ प्रैक्टिकल सूत्र (जन्मदिन के आधार पर आयु की गणना करें, ...)   |   19 निवेशन टूल्स (QR कोड डालें, पथ से चित्र सम्मिलित करें, ...)   |   12 रूपांतरण टूल्स (शब्दों को संख्याएँ, मुद्रा रूपांतरण, ...)   |   7 विलय और विभाजन टूल्स (उन्नत संयोजन पंक्तियाँ, विभाजन कोशिकाओं, ...)   |   ... और अधिक

एक्सेल के लिए कुटूल के साथ अपने एक्सेल कौशल को सुपरचार्ज करें, और पहले जैसी दक्षता का अनुभव करें। एक्सेल के लिए कुटूल उत्पादकता बढ़ाने और समय बचाने के लिए 300 से अधिक उन्नत सुविधाएँ प्रदान करता है।  वह सुविधा प्राप्त करने के लिए यहां क्लिक करें जिसकी आपको सबसे अधिक आवश्यकता है...

Description


ऑफिस टैब ऑफिस में टैब्ड इंटरफ़ेस लाता है, और आपके काम को बहुत आसान बनाता है

  • Word, Excel, PowerPoint में टैब्ड संपादन और रीडिंग सक्षम करें, प्रकाशक, एक्सेस, विसियो और प्रोजेक्ट।
  • नई विंडो के बजाय एक ही विंडो के नए टैब में एकाधिक दस्तावेज़ खोलें और बनाएं।
  • आपकी उत्पादकता 50% बढ़ जाती है, और आपके लिए हर दिन सैकड़ों माउस क्लिक कम हो जाते हैं!
Comments (22)
No ratings yet. Be the first to rate!
This comment was minimized by the moderator on the site
Thank u very much for important scientific information
This comment was minimized by the moderator on the site
How to calculate average of percentage CAGR Return ?
Example :

28.6%

34.9%

25.5%

-2.8%

16.0%
This comment was minimized by the moderator on the site
You can also just use the RATE() formula with setting PMT to 0. RATE(9,0,-549,987) = 6.73%. Built right into Excel already.
This comment was minimized by the moderator on the site
Your period is wrong in CAGR formula ?
This comment was minimized by the moderator on the site
I agree, there's only 9 periods from 1/1/11 to 1/1/20. Ten periods would be 1/1/11 to 12/31/20. Please explain
This comment was minimized by the moderator on the site
Hi - I'm trying to work backwards to find the highest price I can buy a share at when I have a total expected return. Are you able to please help me by reverse engineering the formula to work this out. Using your example - I'm trying to work out what the "3" should be 2.43443 =(3200/x)^(1/(40-8))-1
This comment was minimized by the moderator on the site
Hi,

I have 7 fiscal years of foot traffic data for a retail store:

FY12 FY13 FY14 FY15 FY16 FY17 FY18
2653 2848 2871 2925 2685 2923 3000

My question is: while traffic is increasing, is it increasing at a decreasing rate? Is the growth slowing?


Your first example "(B11/B2)^(1/(10-1))-1" takes the end value and beginning value to get the CAGR. The part I don't understand is that, what about the values in the middle? How does only taking the end and beginning value determine the growth rate accurately? Is there another method where it takes all the fiscal year values into account?
This comment was minimized by the moderator on the site
FY12 - 2653
FY13 - 2848
FY14 - 2871
FY15 - 2925
FY16 - 2685
FY17 - 2923
FY18 - 3000
This comment was minimized by the moderator on the site
Hi Robert,
You can use this formula = (Ending Value - Beginning Value) / Beginning Value to calculate the growth rate of each year, and then compare those growth rates one by one.
This comment was minimized by the moderator on the site
Can someone help with this problem using excel?

The following data show average growth of the human embryo prior to birth.
EMBRYO AGE IN WEEKS WEIGHT IN GRAMS
8 3
12 36
20 330
28 1000
36 2400
40 3200

a). Find the quadratic function of “best fit” for this data. Write this function in standard form: f(x) = ax2 + bx + c.
b). Make a sketch of the scatter plot and the parabola. Plot the quadratic function found above the Y = menu.
c). According to your model, what would a 32-week embryo weigh?
d). According to your model, what week would an embryo weigh 3000 grams?
e). Could the model be used for weight of an embryo for any number of weeks age (such as 100 or 200)? Explain
This comment was minimized by the moderator on the site
Hi Wayne,
You can calculate the Compound Annual Growth Rate with the second method:
=(3200/3)^(1/(40-8))-1
This comment was minimized by the moderator on the site
There is a new tool that will fit to your planning software. MS Excel is a spreadsheet developed by Microsoft for Windows, macOS, Android and iOS. It features calculation, graphing tools, pivot tables, and a macro programming language called Visual Basic for Applications. Thus, it can do Bookkeeping/Accounting, Budgeting (Existing Year and Long Term) and Data Analysis.
This comment was minimized by the moderator on the site
In the CAGR formula, why we are using -1 at the end. I am using two formulaes 1) (I5/I4)^(1/(25-1))-1 2)(I5/I4)^(1/(25)-1) which one is correct..? Please help me out on this thank you.
This comment was minimized by the moderator on the site
The first formula you are using is the correct one!
This comment was minimized by the moderator on the site
The formula is actually CORRECT, but the explanation is incorrect. There are 10 dates that represent 9 periods. It should say that "n-1" means "dates-1", not "periods - 1". You can verify it yourself by increasing each year by this example's n-1 CAGR and you will get the final result.
There are no comments posted here yet
Load More
Please leave your comments in English
Posting as Guest
×
Rate this post:
0   Characters
Suggested Locations